The Story Behind the Count — Data Visualisation for a Privacy-Centric Product
Showing members how their online accounts change over time, so they can see the effect of their actions and decide what to do next.
Showing members how their accounts change over time
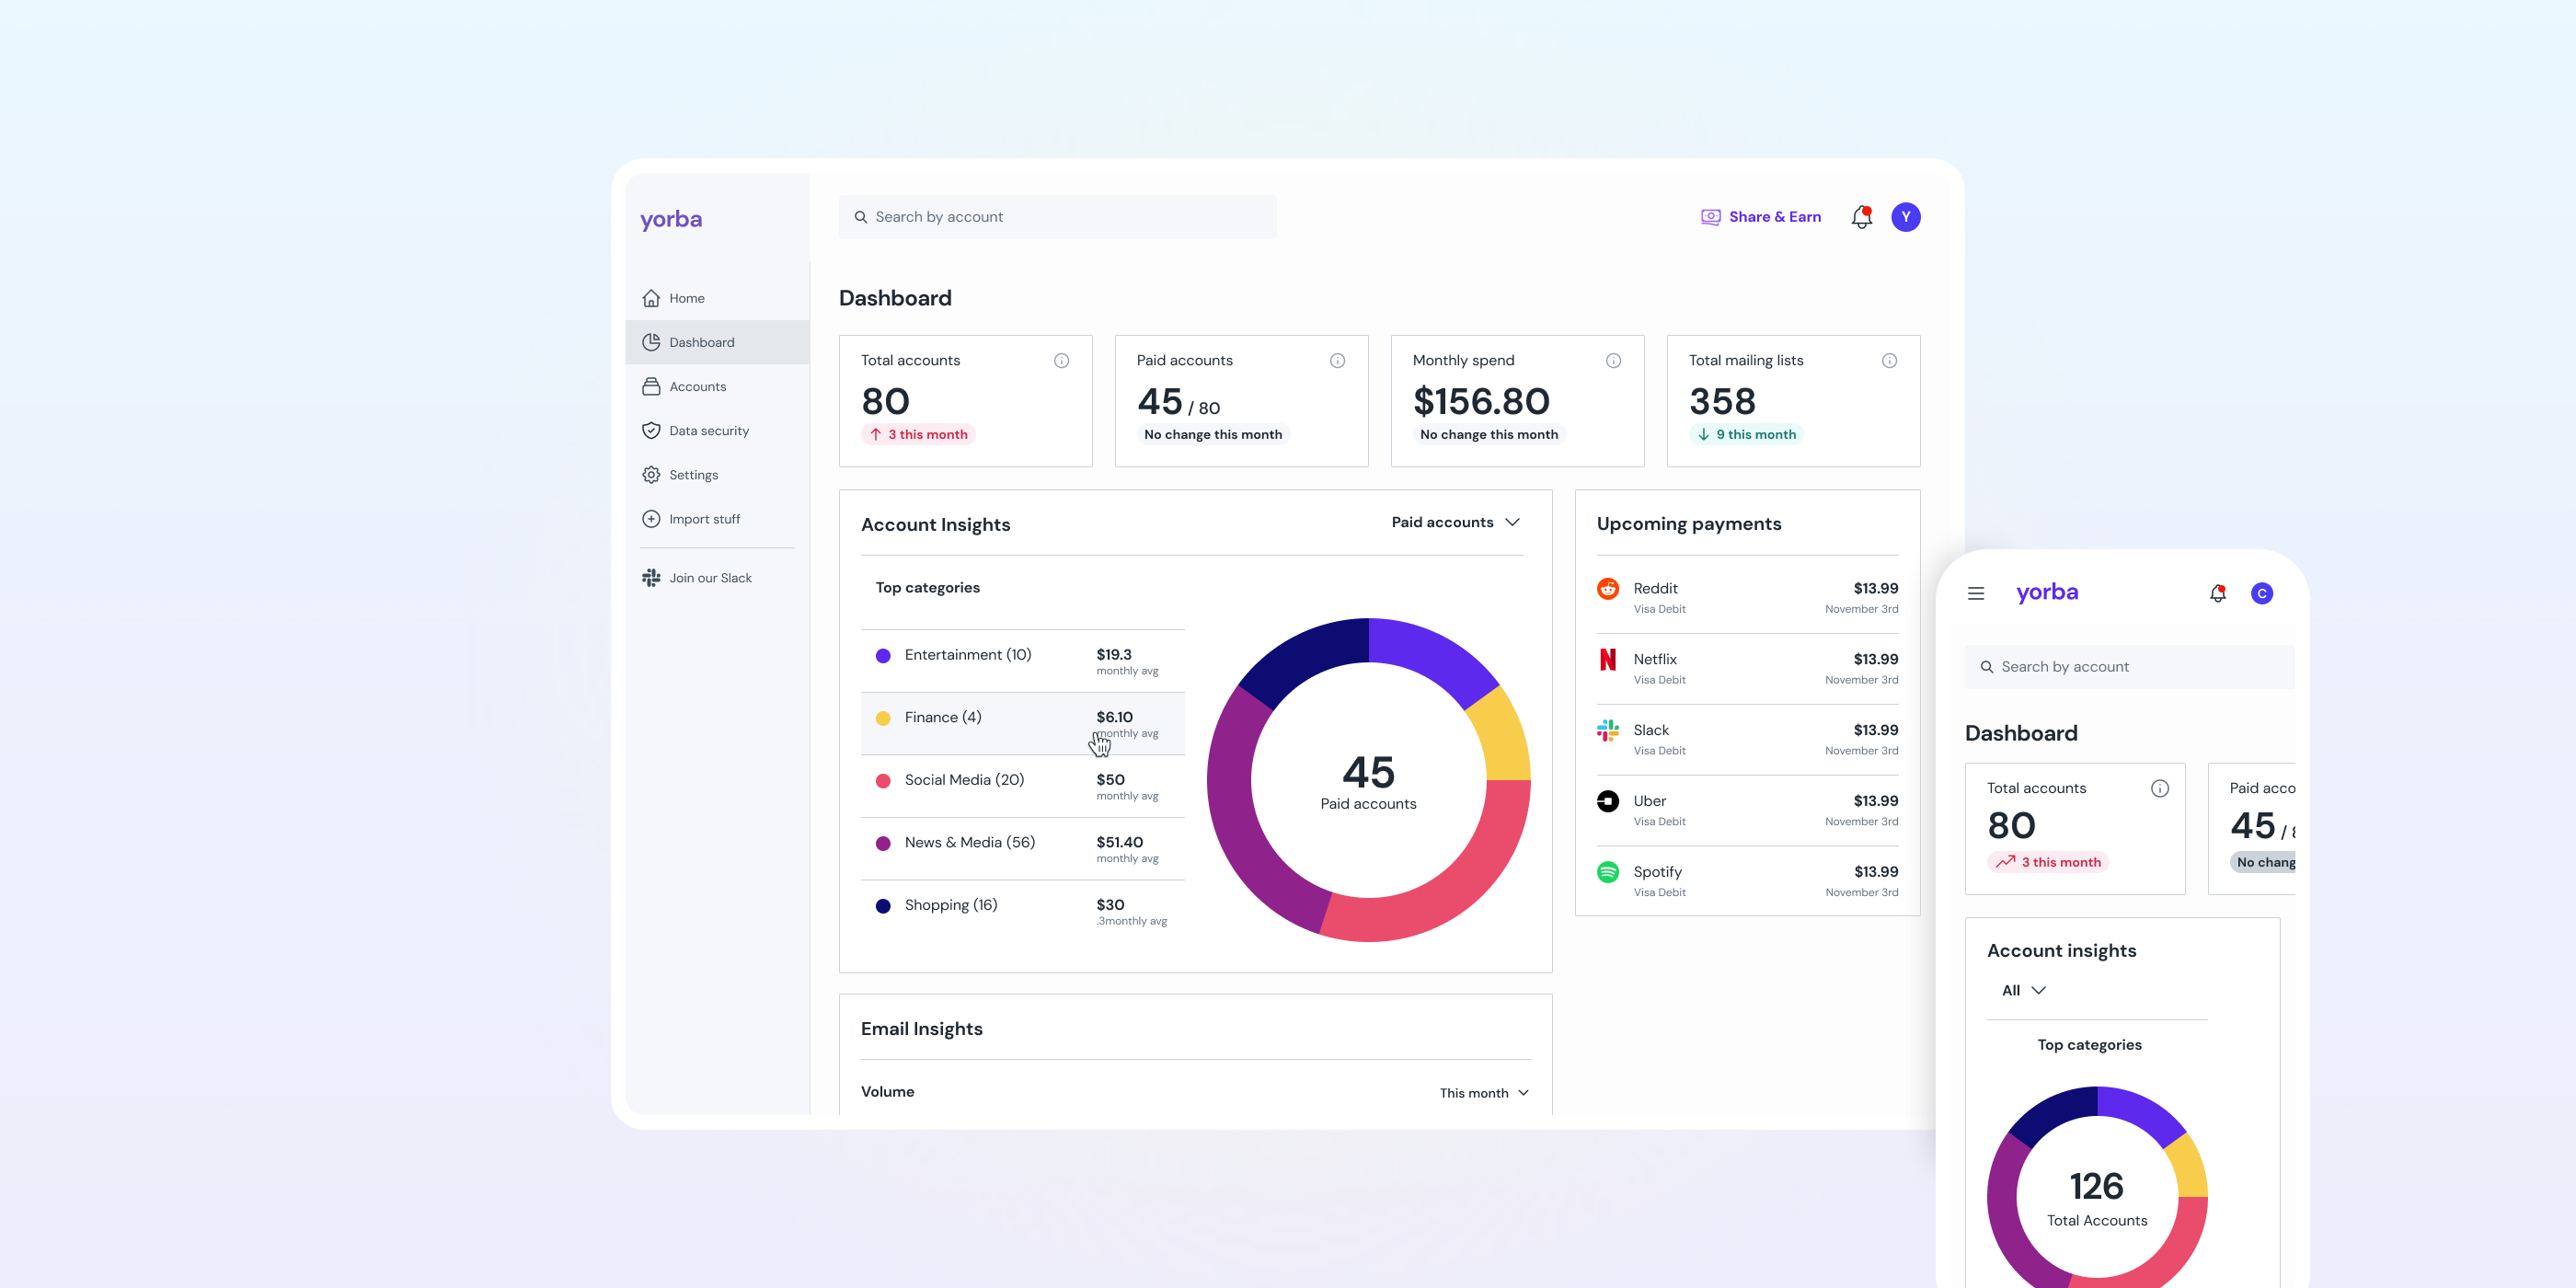
Yorba scans your email and banking to find the relationships you have online: logins, subscriptions, mailing lists, data breaches. The dashboard told members how many of each they had, but that was it. Static counts. No sense of whether things were improving or getting worse after you took action.
This project added data visualisation to each account type screen so members could actually see movement over time and make better decisions about what to do next.
"How do we move from static counts to in-context data visualisation that shows change over time and leads members toward action?"
Counts without context
The dashboard showed totals. Fee-paying and free accounts were mixed together, emails lived on a separate screen, and everything was static. If you spent an afternoon deleting old logins, the number went down, but there was no record that it had been higher. No trajectory. No feedback loop.
A previous Shape Up cycle had already split account types into their own screens with stats and tables. That was a real improvement, but the numbers still sat flat on the page. Members had the data. They didn't have the picture.
Data constraints shaped the charts
The previous cycle set the direction
Separating account types into distinct screens had already been validated. This project picked up from there and extended the work into visualisation.
Each account type needed a data audit
Before I sketched anything, I mapped three layers for each account type: what data the platform actually had, what could be derived from it, and what meaning that derived data carried for someone deciding what to do next. Then I matched chart types to the question each screen needed to answer.
Labels had to land with a general audience
Interviews and usability testing checked whether the charts communicated what we intended. Every label, axis name, and category had to make sense to people who aren't comfortable reading charts. A copywriter helped get the wording right.

Matching the chart to the question
Extending what was already there
I built on the stats structure from the prior cycle. Charts had to extend what those screens already communicated, not sit alongside them as decoration. Quick filters came up in testing, but the UI complexity and engineering effort didn't justify prioritising them over the core visualisations.
Deciding the right chart
Mailing Lists
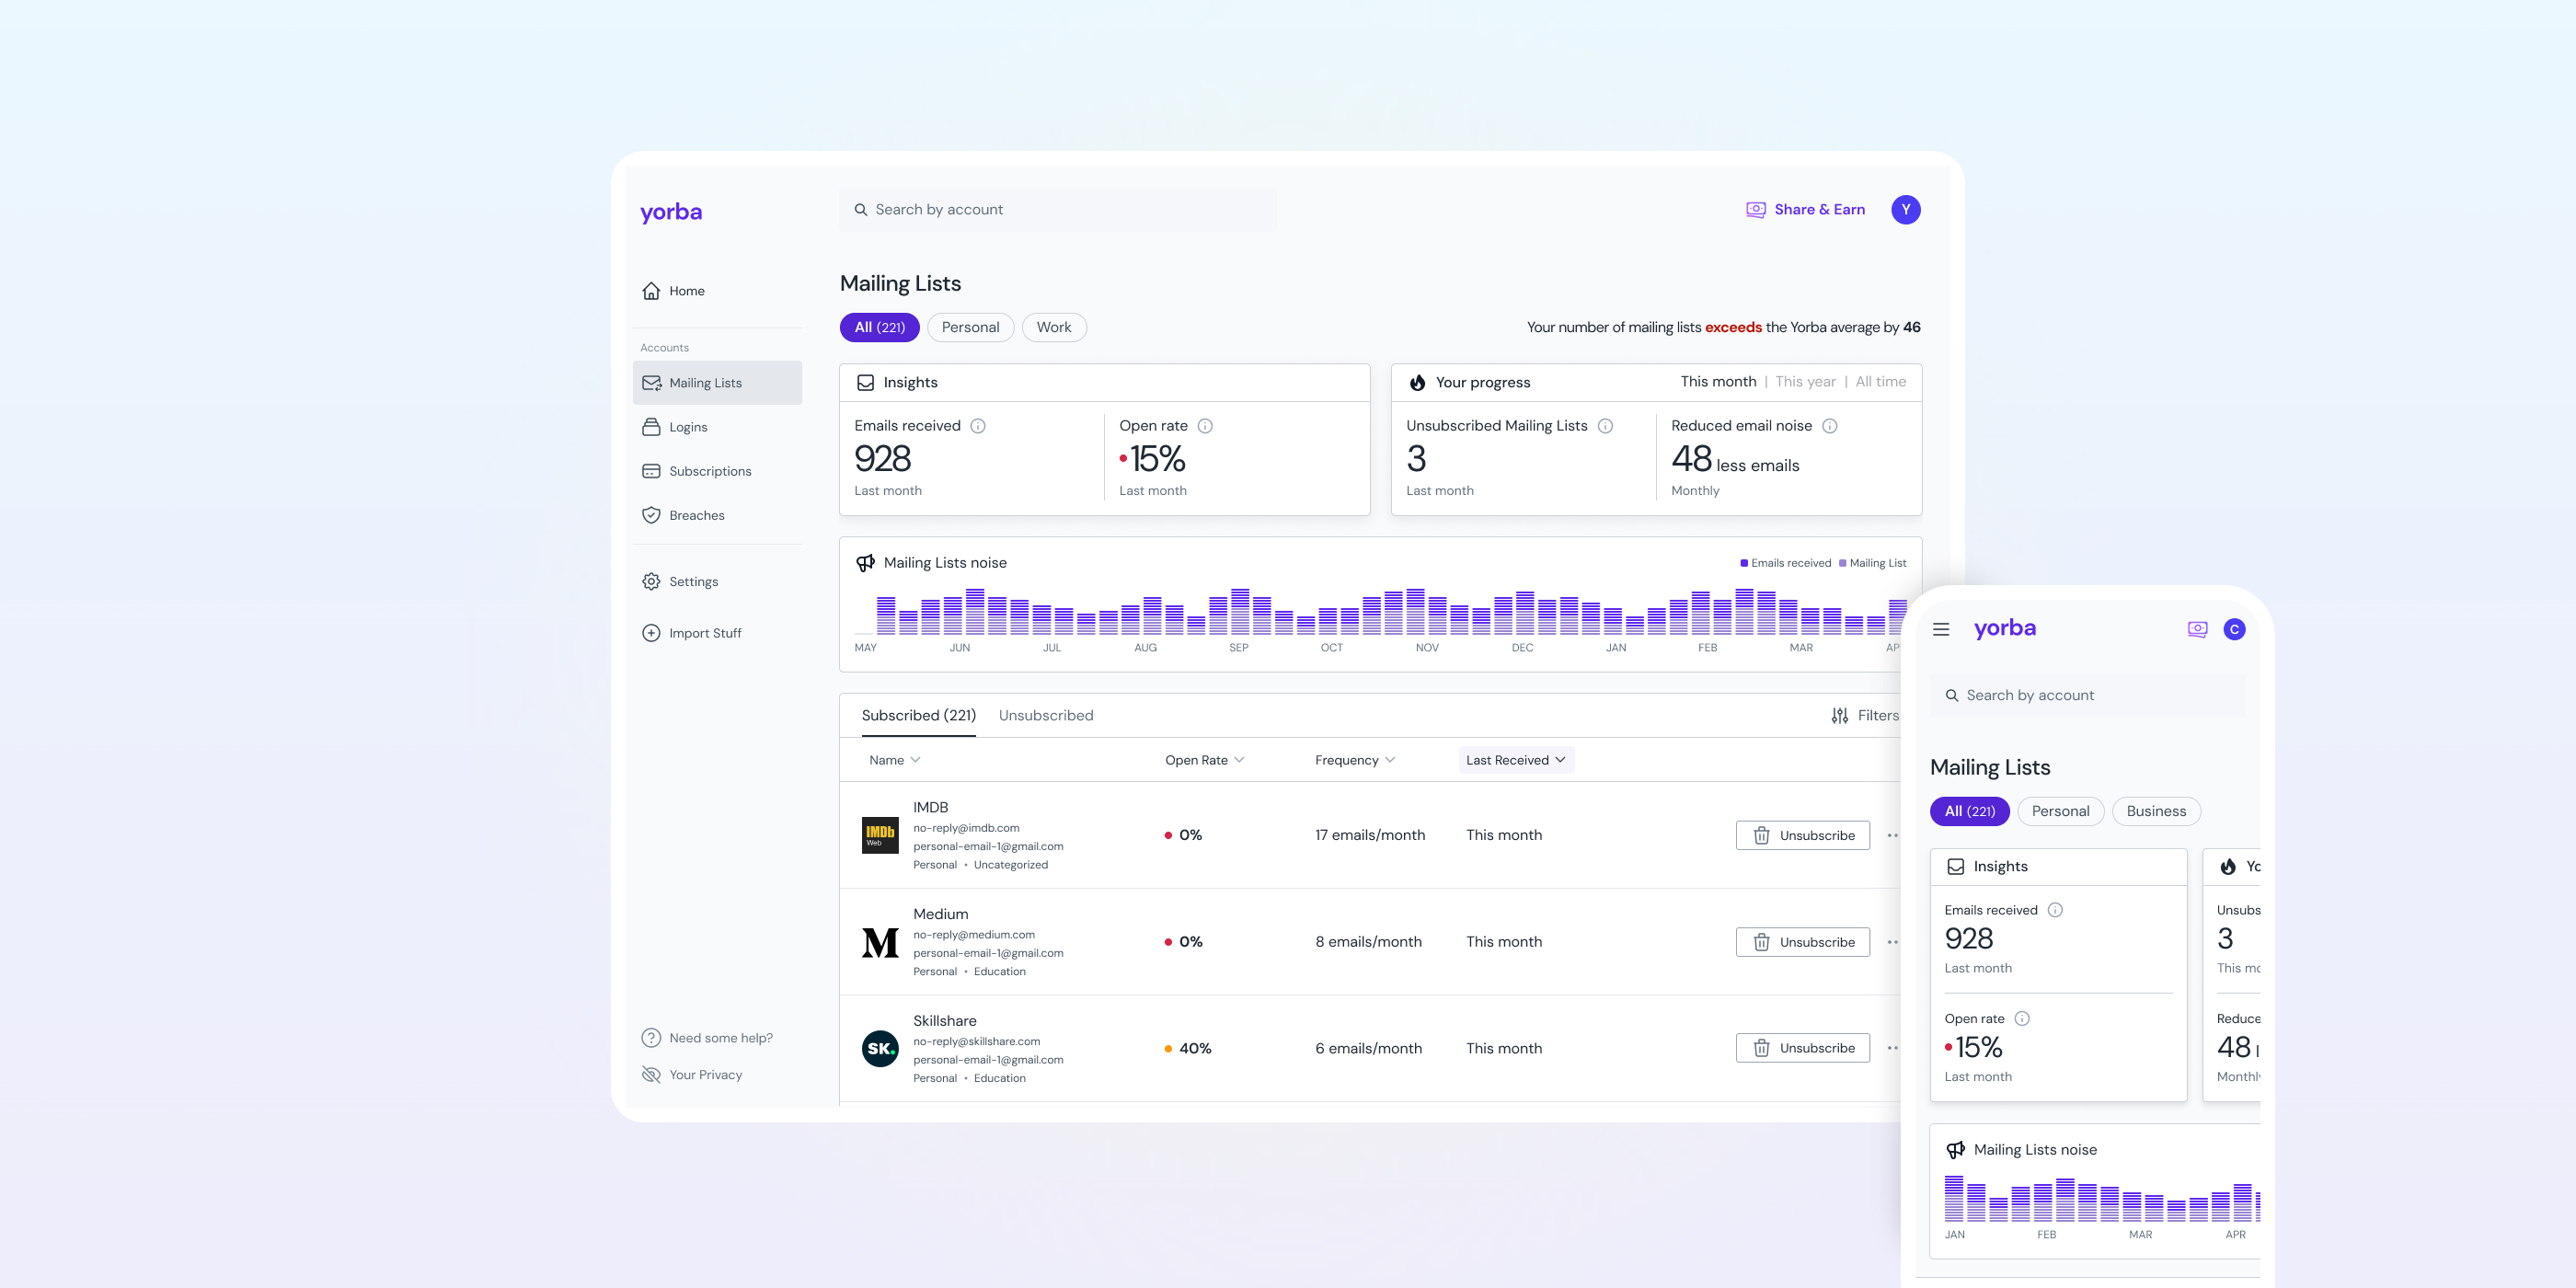
Similar logic: how is volume changing? Yearly view with weekly columns, stacked bar chart showing mailing lists received and emails from active lists. The question is both about change over time and composition.
Logins
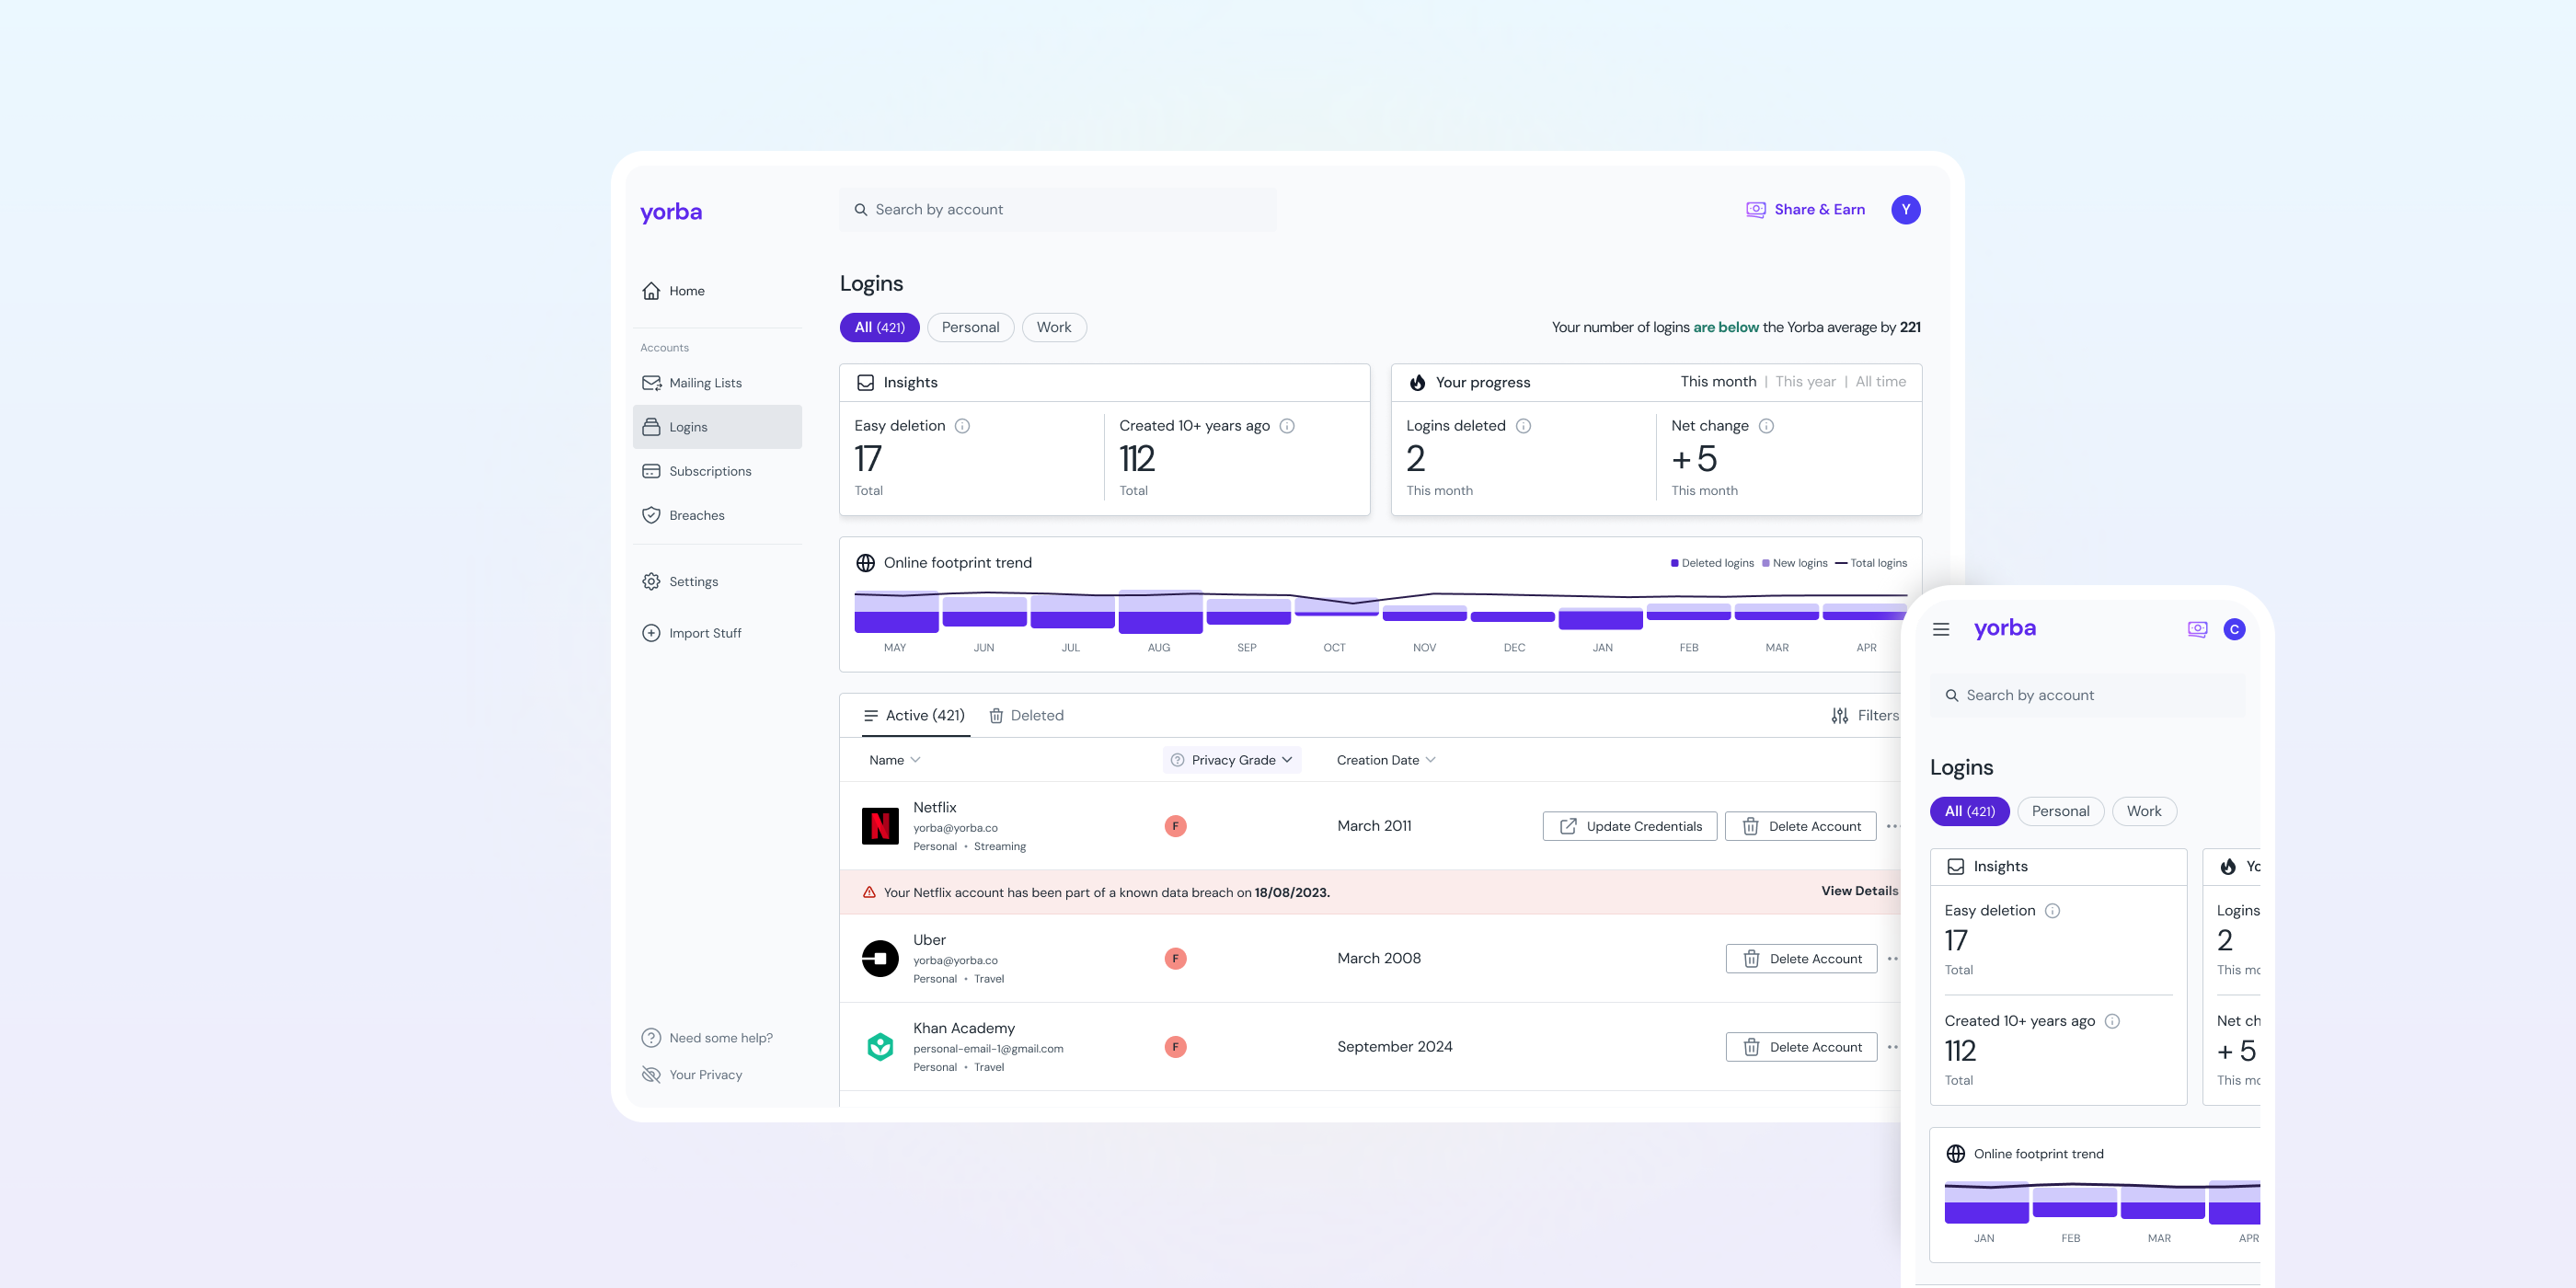
This was the clearest case: are my accounts growing or shrinking? I went with a diverging bar chart, monthly, with new accounts above and deleted accounts below the X axis. A trendline overlay shows total logins. A simple bar chart would have hidden the deletion signal. When someone spends time cleaning up accounts, that effort should be visible.
Subscriptions
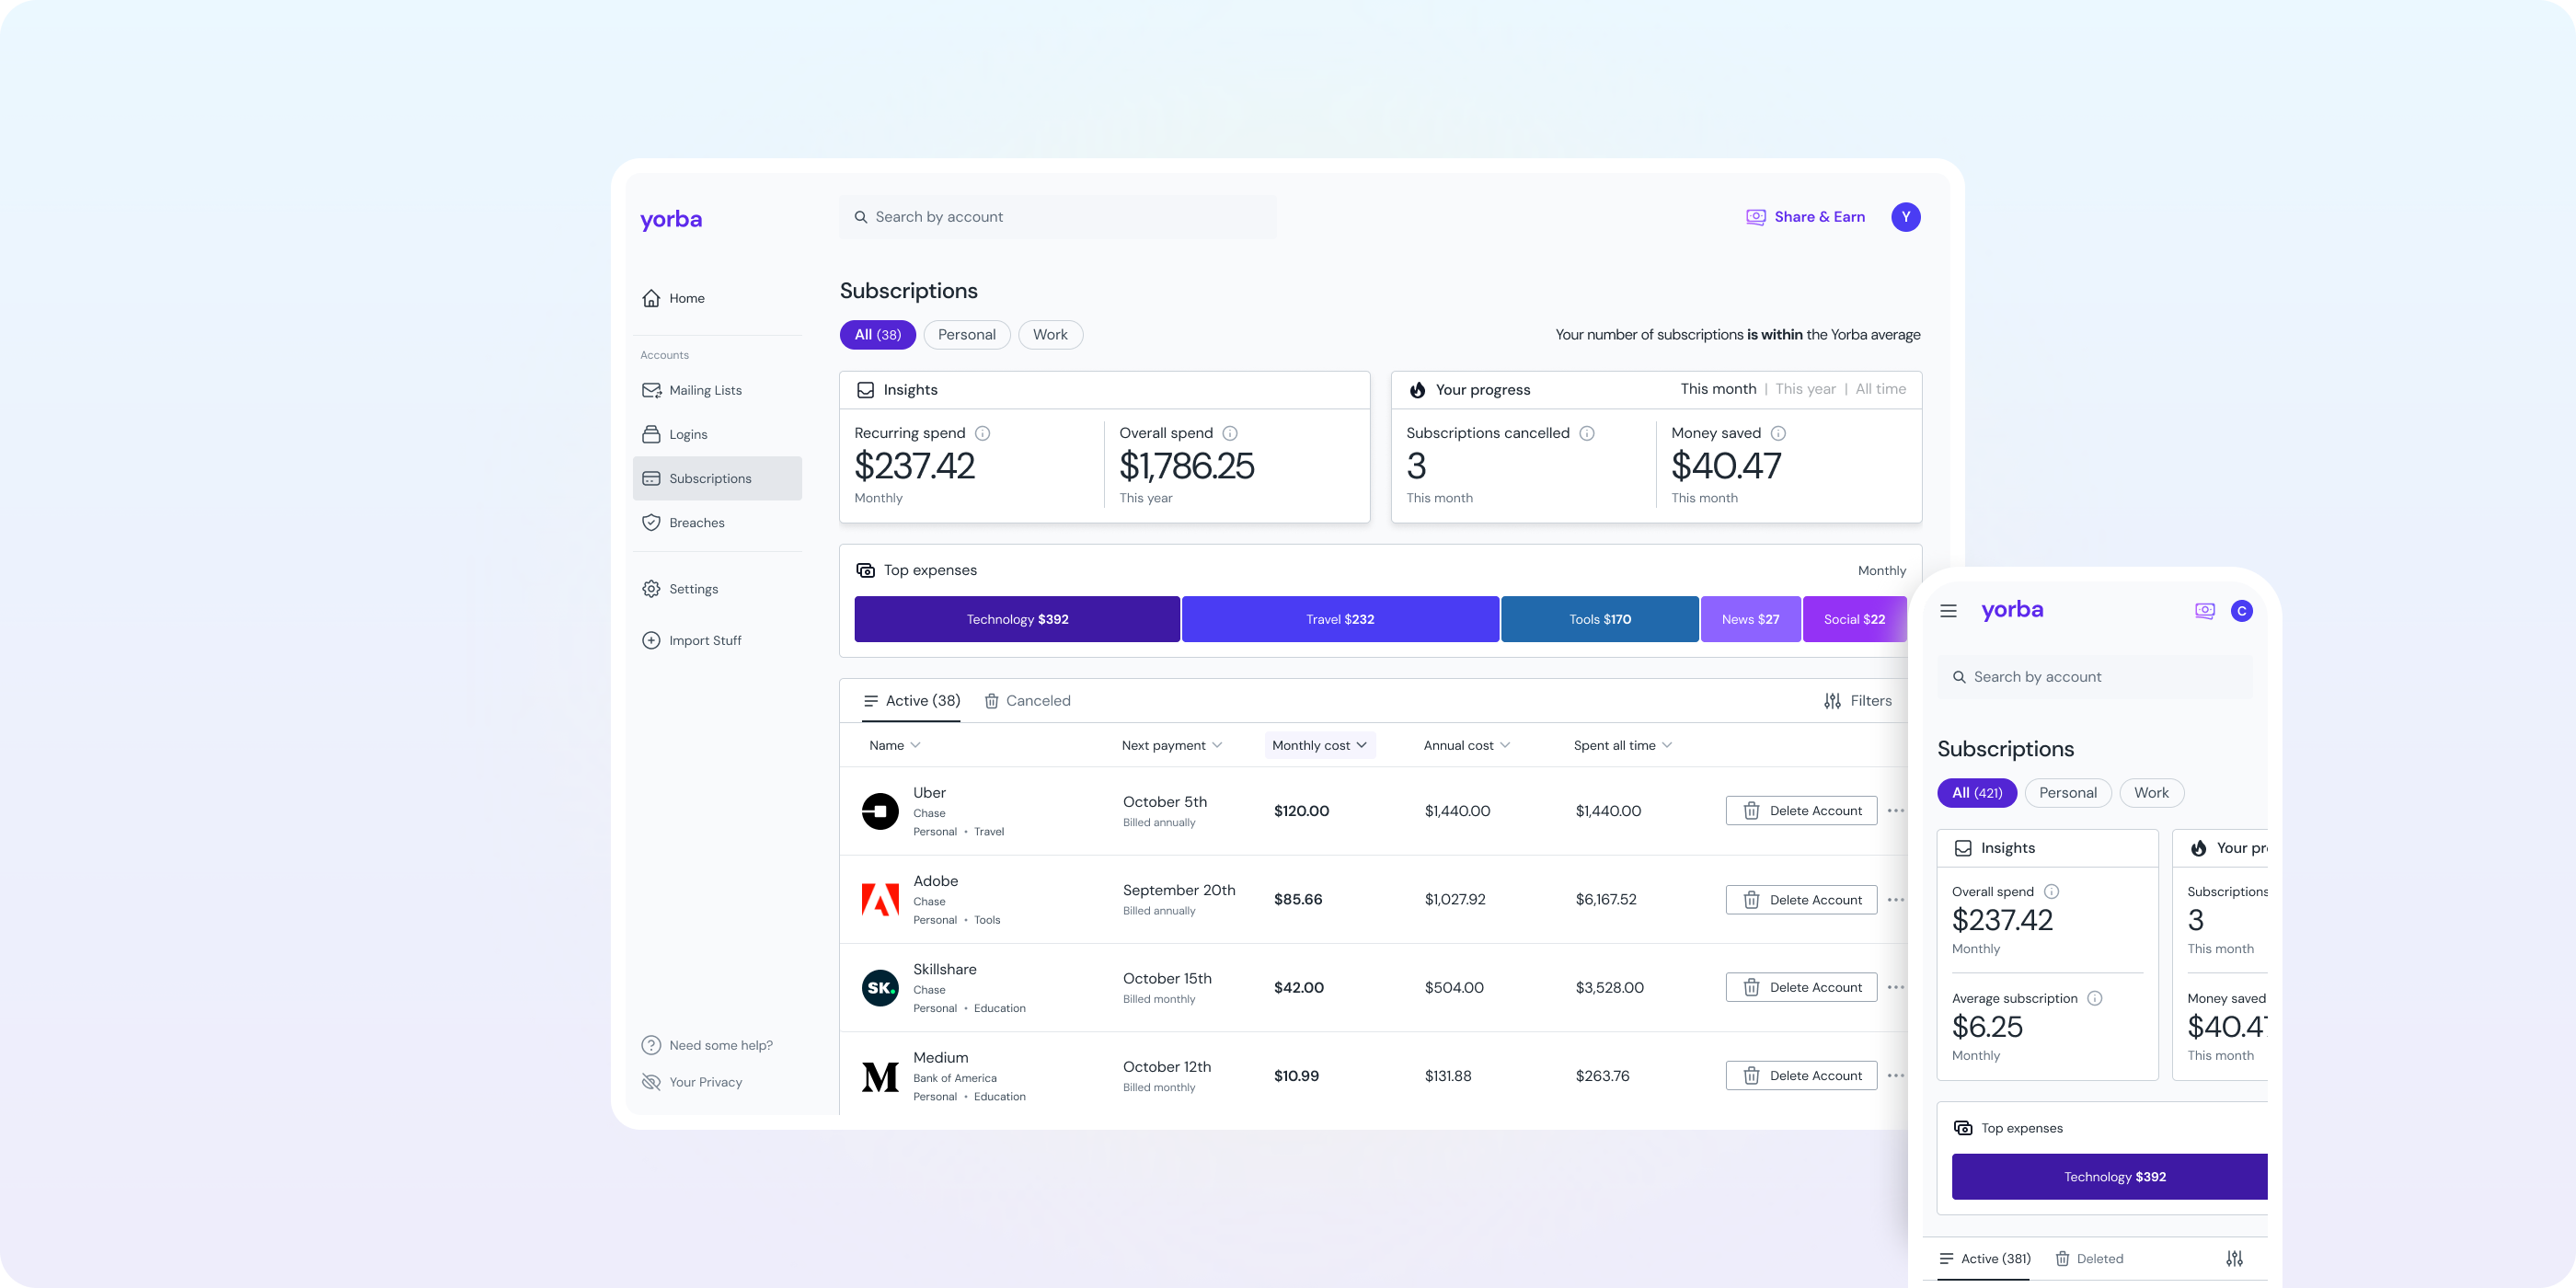
Where is my money going? Monthly stacked bar chart by category, top six shown. Clicking a category tile filters the table below. I ruled out a pie chart because it falls apart with more than three or four segments, and subscription categories routinely exceed that.
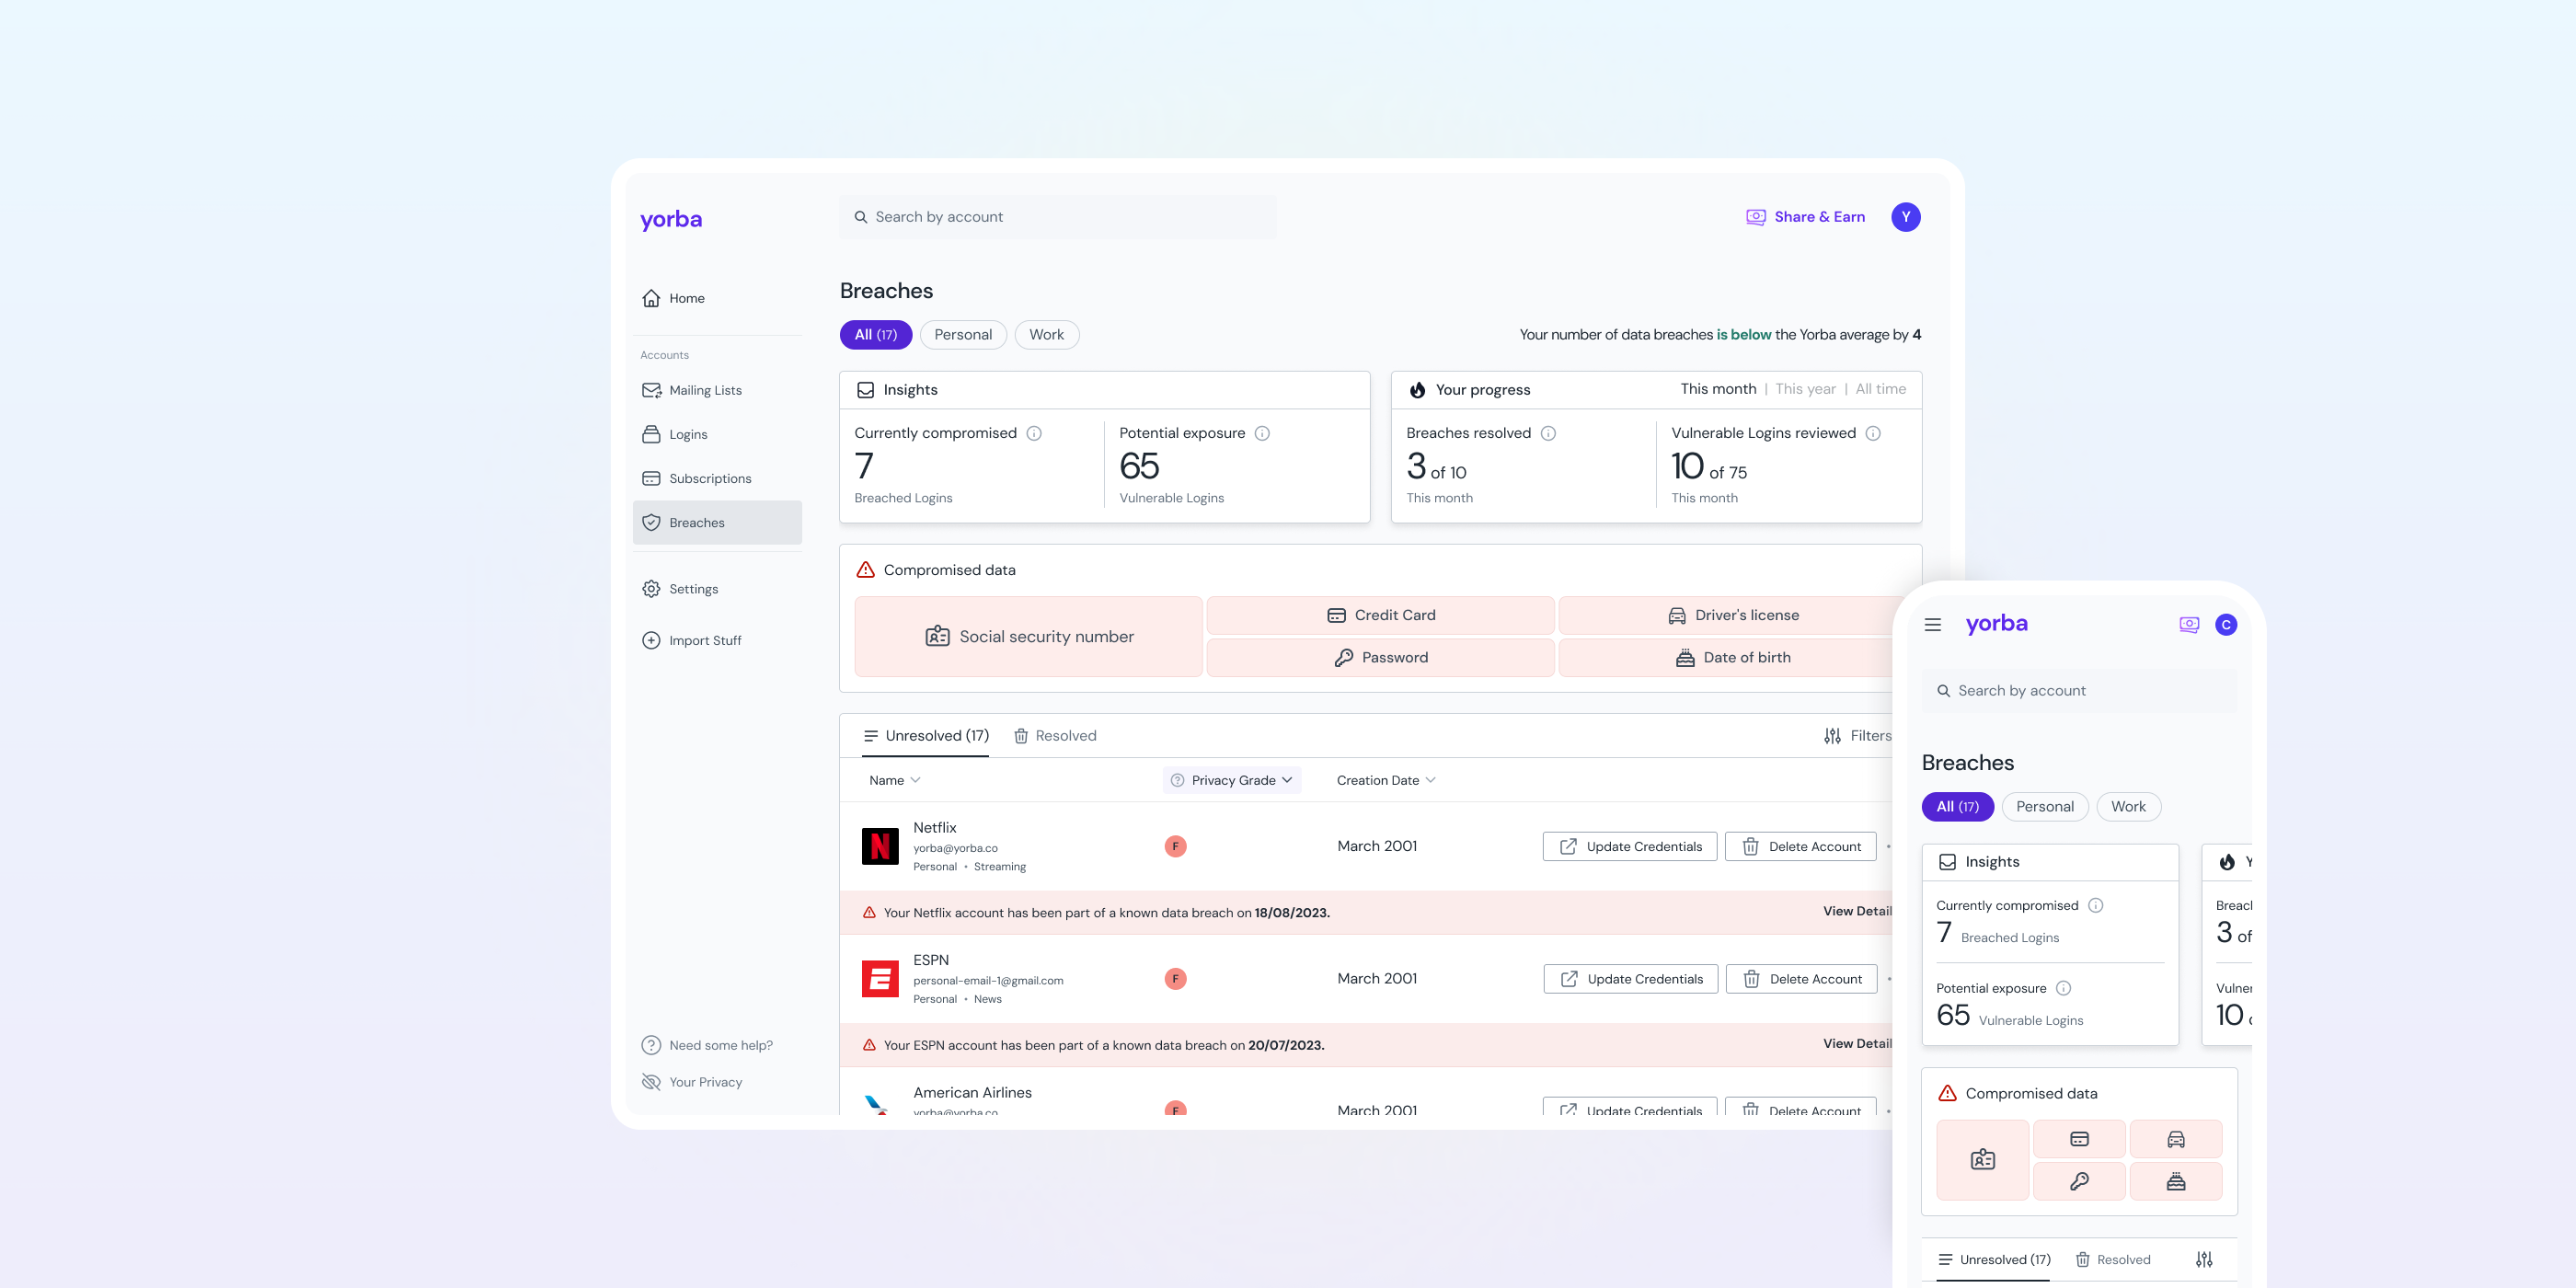
Breaches
The outlier. This isn't about change over time but exposure: which types of personal data have been compromised? I chose a treemap because it handles many categories while showing severity through tile size. Bubble chart was the other option, but it's harder to read on small screens and less space-efficient. Clicking a tile filters the breach table.
From chart to action
Each visualisation sits above the detail table. Where it makes sense, interactive elements filter that table directly. The chart is never the destination. It leads to a decision, and for most account types, it shows the effect of decisions already made.
Four charts, four different questions
Mailing Lists
Yearly stacked bar chart with weekly columns. Shows mailing list volume and email volume from active subscriptions.
Logins
Yearly diverging bar chart with monthly columns. New accounts above, deleted below, trendline overlay for total logins.
Subscriptions
Monthly stacked bar chart. Spend broken down by category, top six shown, with interactive tiles that filter the table below.
Breaches
All-time treemap. Fourteen icon-mapped categories, ordered by a sensitivity ranking I built with the team, tile size representing volume. Clickable tiles filter the breach table.
Shipped on schedule, across two cycles
Both Shape Up cycles shipped on time as part of Yorba's New Platform UI epic. The previous screens gave members metrics and tables. These visualisations show how accounts change over time and whether actions are making a difference.
Members noticed. The charts became one of the most commented-on parts of the product. People liked seeing their digital weight laid out visually and often said it looked cool. It also gave them a reason to act: watching numbers move after cleaning up accounts, unsubscribing, or cancelling forgotten subscriptions made the effort feel real. Each chart pointed to what to do next, whether that was spotting a spending habit or seeing which personal data had been exposed in a breach.
The chart was the easy part
Before any chart could be sketched, each account type needed working through: what data existed, what could be calculated from it, what that calculation meant to a member, and whether the words describing it would make sense to someone who isn't a security analyst. That sequence repeated for every account type and took more time than the visual design itself.
Running two overlapping Shape Up cycles meant shaping the second while building the first. That created a practical feedback loop. The interaction pattern of chart tiles filtering the table, established in the first cycle, became a settled convention for the second. The second cycle moved faster because the foundational decisions were already proven.
What surprised me was how much working directly with engineering on the dataviz rules sped up development. I defined how each chart should behave across every edge case upfront: what happens with no data, single entries, extreme outliers. Engineering didn't have to stop and ask or make assumptions. The dataviz development moved faster than I expected, and it shifted how I think about where design work happens. A lot of it lives in the logic and edge case definitions, not the visual layer.